Introduction
In 2021 we set ourselves the ambition of being able to handle 1000 hits/s on our API endpoints. To demonstrate that we are ready to scale with IPFS and that we can handle large-scale integration as the first and only search and discovery platform within the IPFS ecosystem.
This is the second post in a 2-post miniseries where we explain the challenges we faced scaling up, and how they were eventually overcome. In the previous post we dealt mainly with low response times as we scaled our cluster to 33 nodes. We will now describe how we built a realistic benchmark. It details the problems which we faced scaling up to 73 nodes and how they were overcome by completely restructuring our indexes.
Finally, we can say that our platform can handle well over 1300 hits/s with <150ms for 95% of requests, equivalent to serving 3100 unique users.
Building a real-world benchmark
Caching in OpenSearch
As with any real-world web-application, our search engine and it’s backend OpenSearch, heavily rely on caching. Particularly, the Lucene indexes on which OpenSearch is built uses memory-mapped files, transparently allowing the OS kernel to keep all or parts of the search index in RAM. This means that Lucene can read files as if they are already in memory. It also means that there is simply no way to switch caching off. On top of this, OpenSearch has caches for requests, for shard data and for sorting and aggregation (field data), which use heap memory. Hence the recommendation to allocate no more than about half of RAM to OpenSearch/Elasticsearch’s heap, the remainder being used by the OS’s VFS (virtual file system) to cache memory mapped files.
This is particularly relevant designing a benchmark for a large database or a search engine. If we were simply to repeat a single request, or a small number of requests, we would not really be benchmarking our search engine — we would be testing the performance of it’s caches instead!
Creating benchmarks from real-world traffic
In order to circumvent this problem, we decided to use actual API requests to model ‘virtual users’. While we do not store any identifiable information on our users (yay, no pesky GDPR banners!), we do in fact log all requests. So we wrote a script and processed some 6 months of log data into visits; browsing experiences of virtual users, based on actual user journeys through our API and frontend.
The result is a 240 MB JSON blob and a short JavaScript file to be used with Grafana’s load tester k6. You can check out our repo to see exactly what we’ve done!
Choosing k6
We just love everything in Grafana’s stack, particularly how they’re AGPL, like us! But we chose k6 because it’s extremly efficient in handling a large amount of parallel sockets, using Golang’s goroutines for fully non-blocking parallel performance while using a JS VM (Goja) for implementing/scripting the actual tests. This ensures that the machine doing the tests is almost never the bottleneck and hence’ (at this scale) we don’t have to worry about coordinating load tests from multiple machines.
Early results
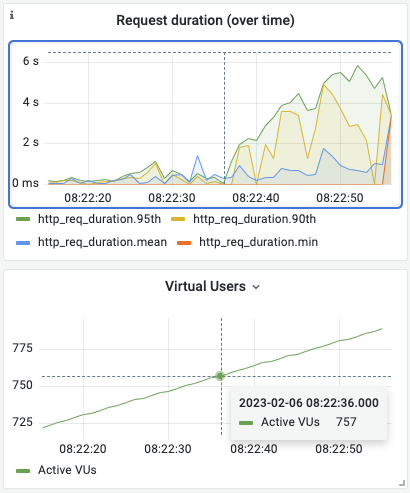
With the tests we created, we can simply select the amount of Virtual Users (VU), or specify ramping in stages to perform tests yielding results like this:
running (5m30.0s), 0000/2000 VUs, 5129 complete and 1604 interrupted iterations
default ✓ [======================================] 2000 VUs  5m0s

     ✗ is status 200
      ↳  79% — ✓ 173720 / ✗ 44841

   ✗ checks.........................: 79.48% ✓ 173720     ✗ 44841
     data_received..................: 516 MB 1.6 MB/s
     data_sent......................: 35 MB  107 kB/s
     http_req_blocked...............: avg=47.9ms  min=0s       med=250ns   max=21.83s   p(90)=400ns   p(95)=491ns
     http_req_connecting............: avg=34.1ms  min=0s       med=0s      max=15.54s   p(90)=0s      p(95)=0s
   ✓ http_req_duration..............: avg=1.25s   min=0s       med=1.54ms  max=1m0s     p(90)=7.31ms  p(95)=99.49ms
       { expected_response:true }...: avg=8ms     min=320.42µs med=1.52ms  max=54.87s   p(90)=5.22ms  p(95)=7.86ms
   ✗ http_req_failed................: 20.35% ✓ 45003      ✗ 176055
     http_req_receiving.............: avg=48.46µs min=0s       med=22.25µs max=103.96ms p(90)=54.67µs p(95)=66.8µs
     http_req_sending...............: avg=30.5µs  min=0s       med=26.5µs  max=17.16ms  p(90)=48.81µs p(95)=57.68µs
     http_req_tls_handshaking.......: avg=12.72ms min=0s       med=0s      max=21.67s   p(90)=0s      p(95)=0s
     http_req_waiting...............: avg=1.25s   min=0s       med=1.47ms  max=1m0s     p(90)=7.18ms  p(95)=99.4ms
     http_reqs......................: 221058 669.854297/s
     iteration_duration.............: avg=1m11s   min=27.92ms  med=50.11s  max=5m26s    p(90)=2m55s   p(95)=3m52s
     iterations.....................: 5129   15.541997/s
     vus............................: 1606   min=1606     max=2000
     vus_max........................: 2000   min=2000     max=2000
This tells us is that 221K requests were performed in 5m and 30s at an average rate of 670/s of which 20% failed, probably due to servers hitting capacity limits. The average request duration was over 1s but 95% of requests were served within 100ms.
In-depth statistics and visualisations
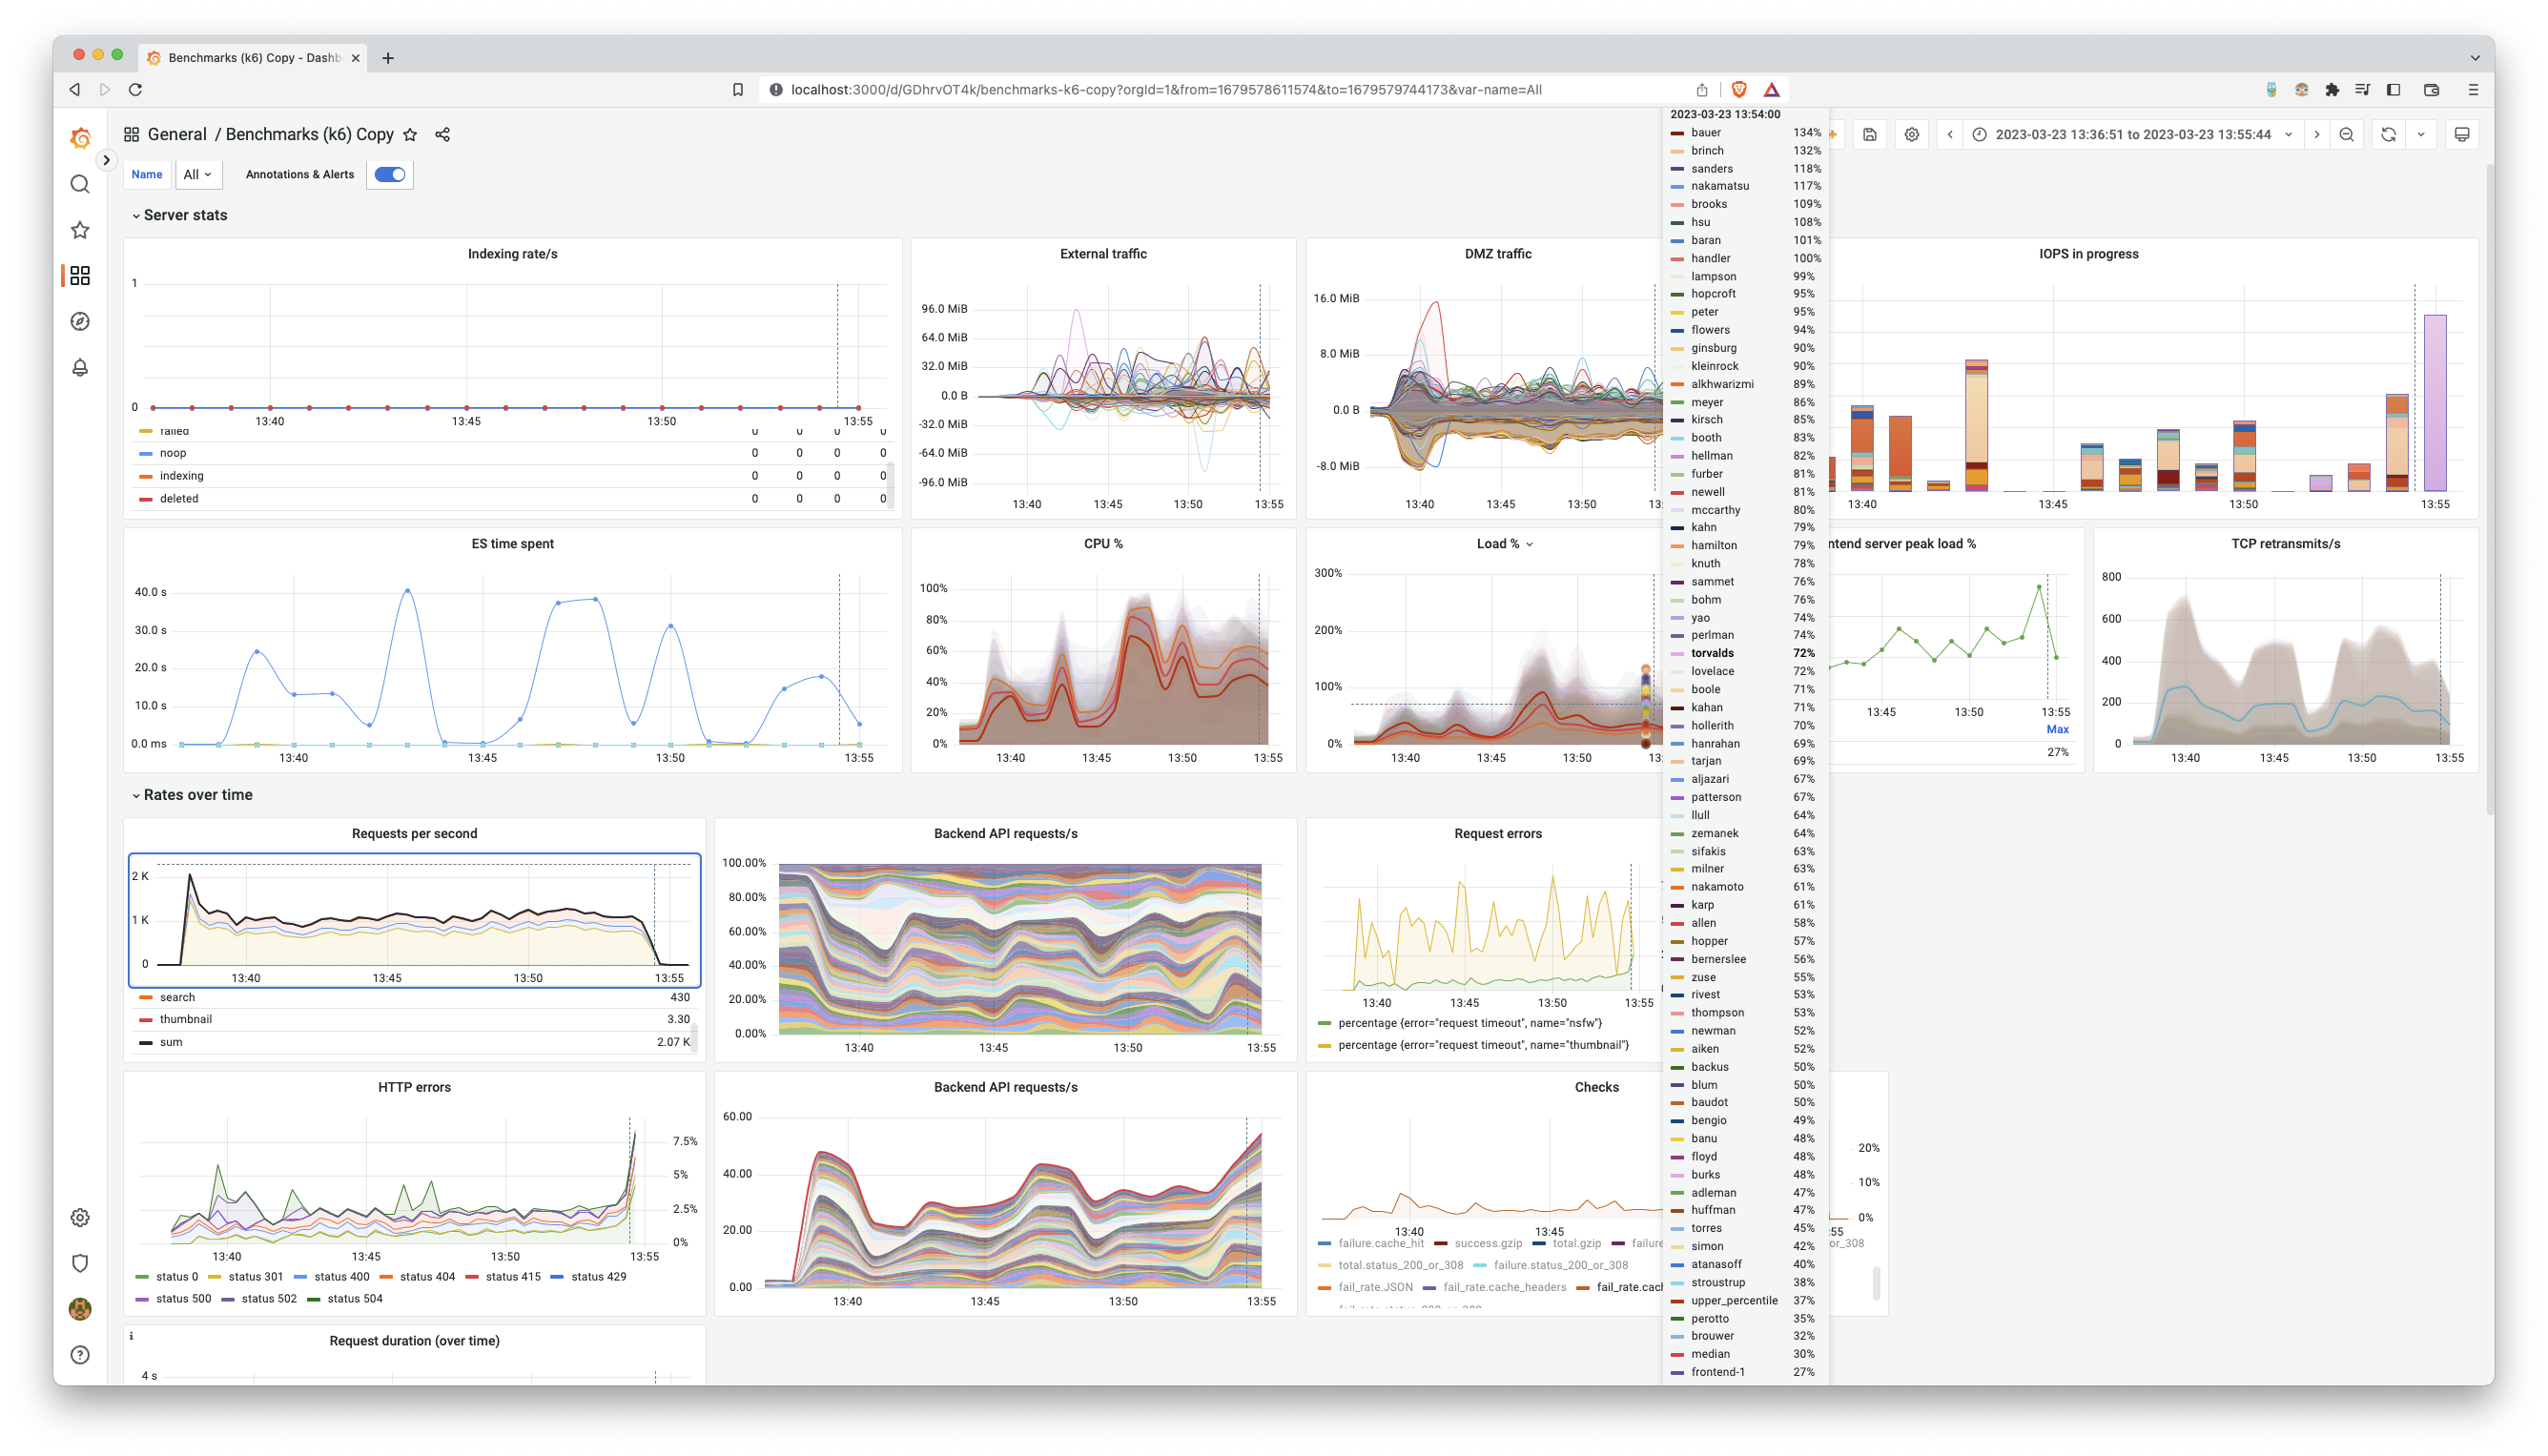
Having a short ASCII summary of a single test is cute, but that doesn’t tell us what we’re after. We need to know what happens to our machines, to our cluster, as we scale it up and… as it breaks. If it does, we need to know how it breaks, figure out why, remediate it and confirm that in fact we did.
In order to do that, we got k6 to write metrics to InfluxDB and created a dashboard visualising the results in Grafana. Both of which we had set up prior to this scale out to investigate latency issues, as discussed in our previous post.
Not the scaling we expected
As soon as we had the tests set up, we started plugging in servers. Over the past year we had been improving our Ansible deployment stack to be able to fully automatically install, configure and setup Hetzner bare metal boxes, so we could deploy any number of nodes in about 30m.
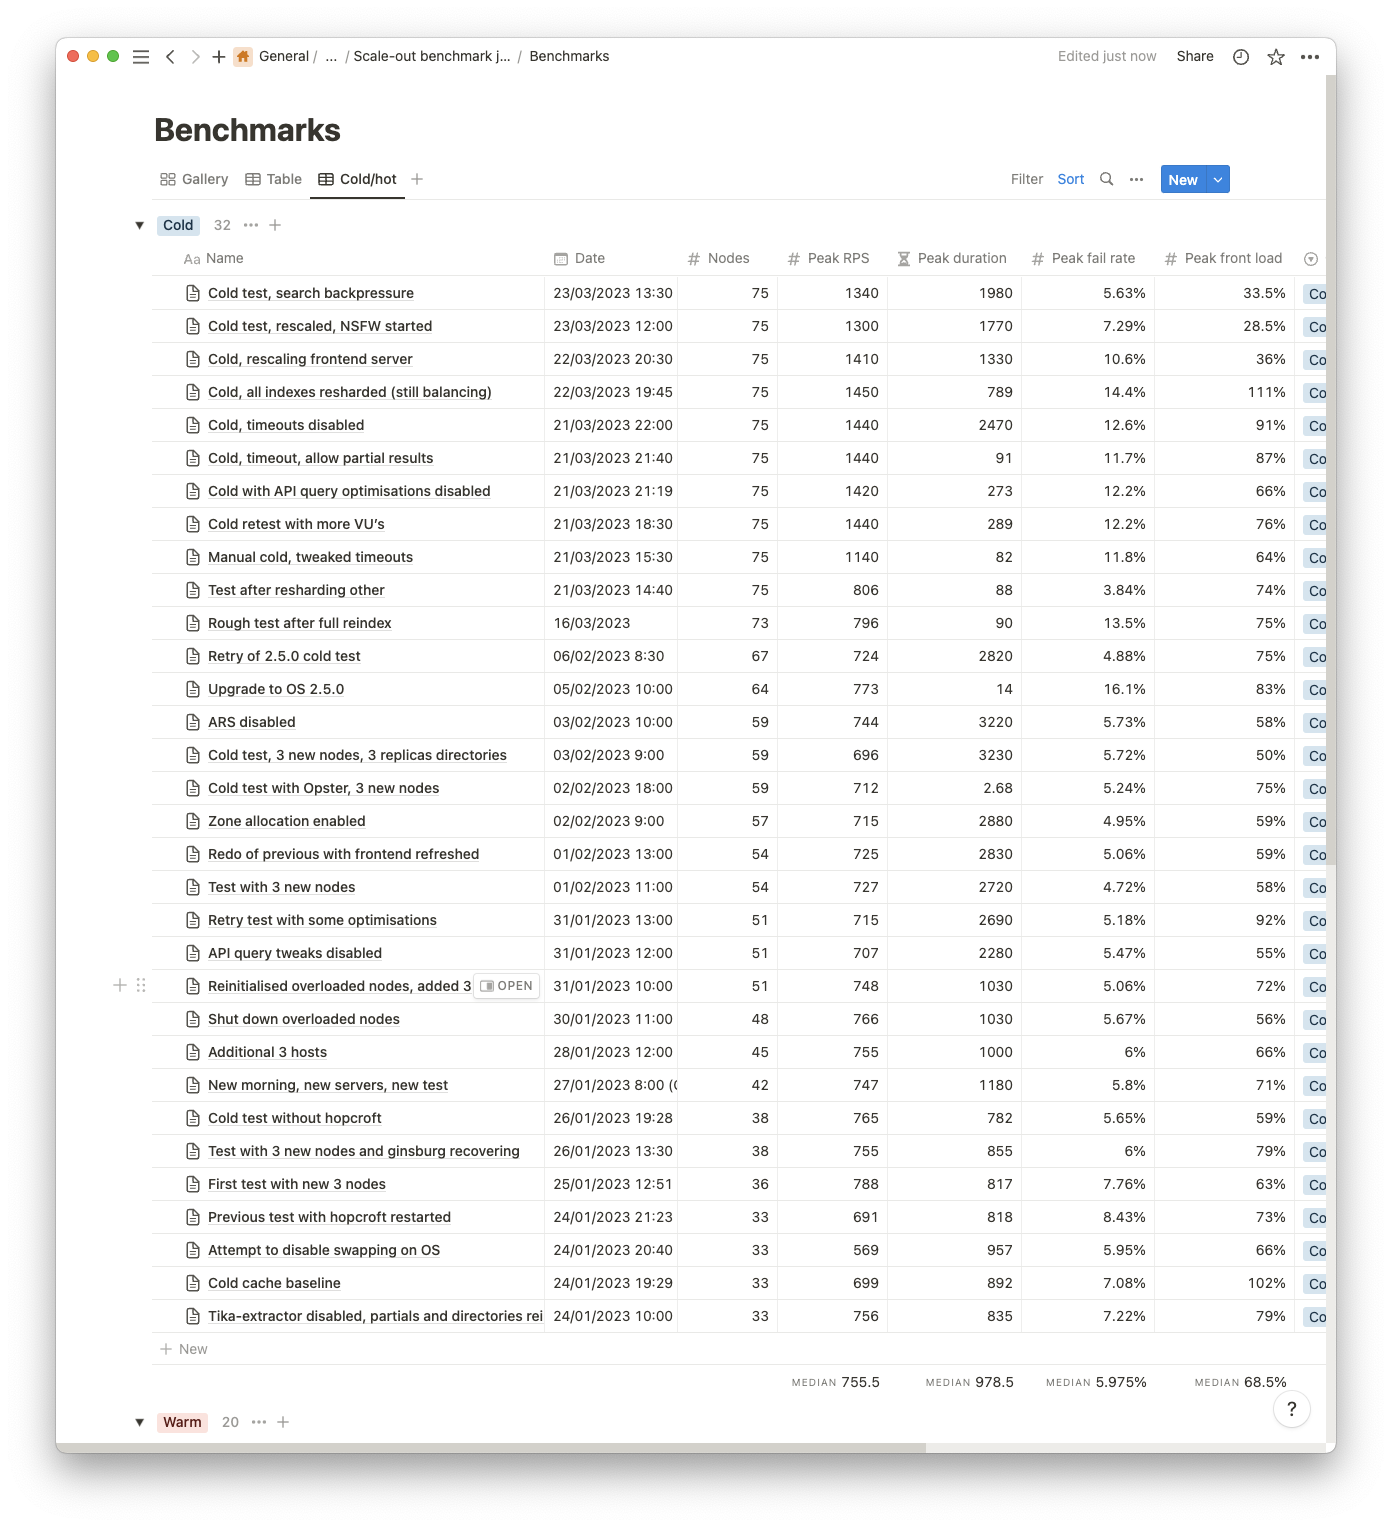
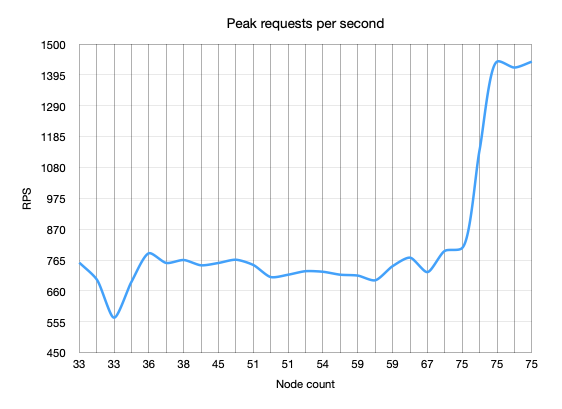
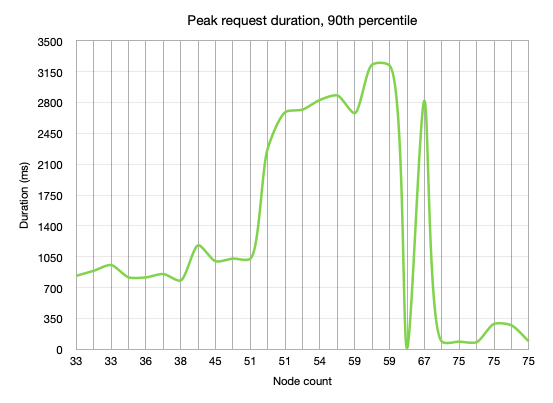
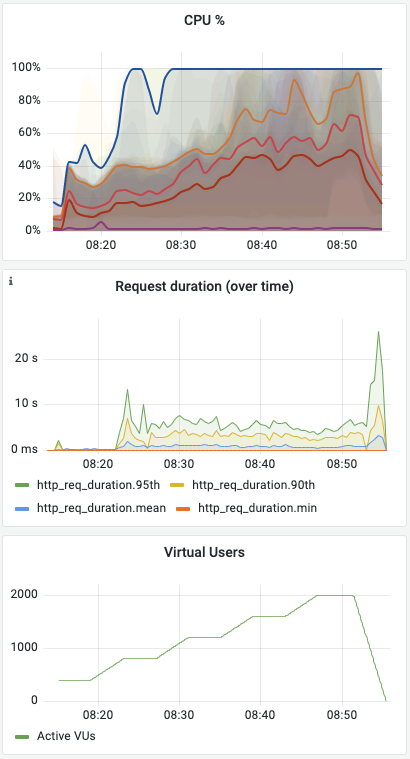
However, as we added nodes and thus capacity, we observed not only that the number of requests per second did not go up, the actual peak duration skyrocketed!
Specfically, with 33 nodes we were peaking around 700 RPS with a peak request duration of around 900ms. With 42 nodes we hit 750 RPS at about 1s. At 59 nodes we were again around 700 RPS with over 3s request durations. Something was definitely wrong!
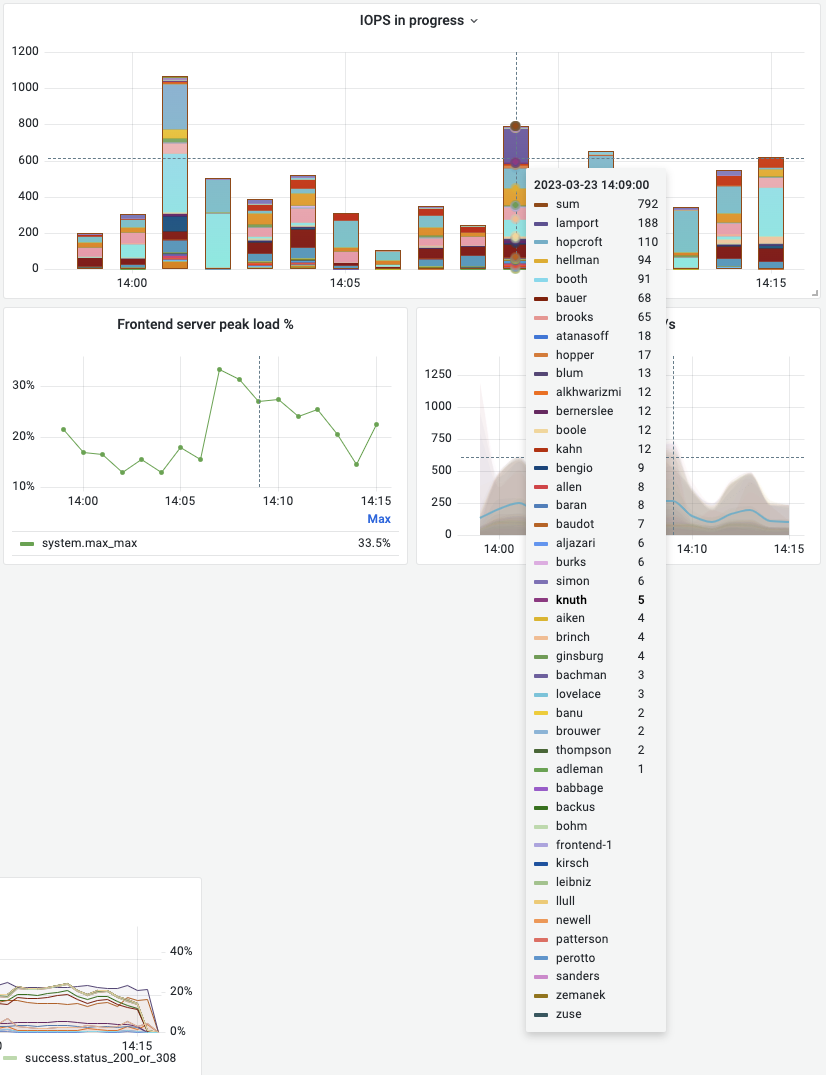
As you may notice from the screenshot, we tried any number of tweaking of settings, upgrading OpenSearch, tweaking our API and even reinstalling our servers. One key aspect which kept returning is that the same 5 or so nodes were handling about 10x the IOPS of the other nodes. It turned out that somehow the cluster decided that these 5 nodes (despite or perhaps due to our myriad of shards) were handling a much greater share of the traffic and were causing a bottleneck in our cluster.
By this time, we had been trying for well over a year to meet our 1000 hit/s benchmark. By now, we really expected to have met the mark, simply by plugging in more servers. Yet, we were forced to acknowledge that a much deeper overhaul was necessary.
We get by with a little help from our friends
By this point, we were despairing and decided to ask for help. Thus far, we had been assisted by DataForest for practical assistance in our deployment setup, like installing Grafana and migrating to OpenSearch. Although we had no budget left, they decided to help us and use our particular and (apparently rare) problem as a study case. They gave us extended and concrete recommendations on how to further optimize our cluster. We owe them a great debt of gratitude and respect, especially considering that they operate from a country in war, Ukraine.
In addition, we opted for a free trial with Opster and, despite our honesty about limited budget they volunteered to have an in-depth look into our issues. They too, were quite suprised by our cluster’s odd behaviour, allocating so much load to just few of the nodes. It might not entirely be an accident that they published an article ‘OpenSearch Hotspots – Load Balancing, Data Allocation and How to Avoid Hotspots’ shortly after assisting us… Regardless, we can’t express enough gratitude for the amount of real-world knowledge about Elastic and OpenSearch they freely put out there.
Both of these parties gave us roughly similar recommendations, among which:
- Put similar data in the same index.
- Only index fields which you’re using.
It did not lead to a single root cause. It seems our problem did not, in fact, have a single clear solution. A basic fact about complex systems, confirmed.
Rethinking our index
It became clear that we had to dig deeper. Despite despairing we could not give up, not with the amount of time already invested. A challenge is not a great challenge if one can be certain to make it!
Splitting our index
Not sure what caused our problems, we took a wild gamble and we decided to do what we had been postponing for years: splitting our index! This is like open brain surgery for search engines! It literally affects every single part of our stack.
We were certain that having 4 huge indexes (files, directories, invalids and partials) was not an optimal solution. We were sure it was going to give performance improvements of some kind. But it is truly challenging to re-index the close to 800 million documents. Just a single typo, and you’d have to do it again. Just a small coding mistake, and you’re losing data. Just one of 73 servers crashing, and you can start again.
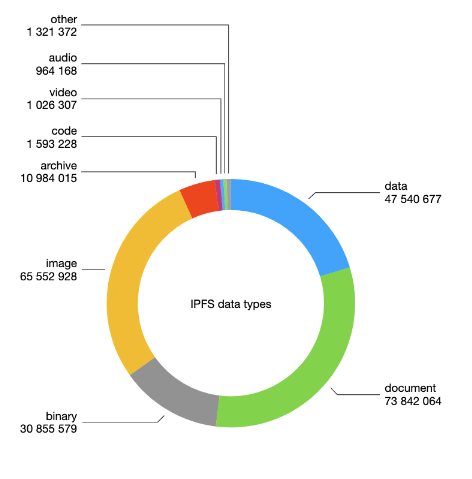
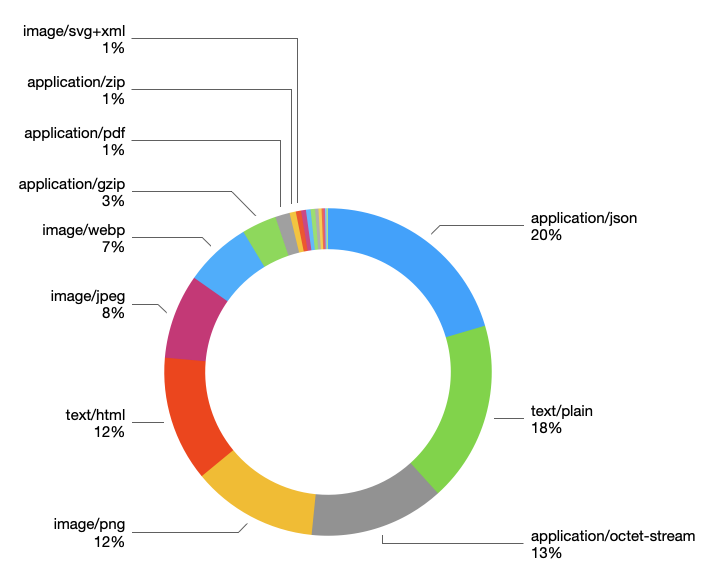
Categorising documents
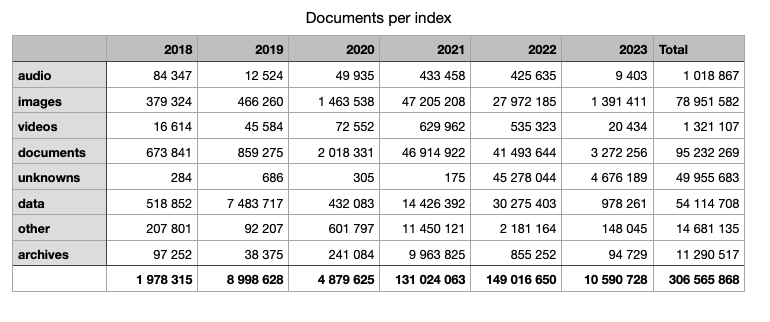
And not just that… how exactly are we going to group our documents? Documents, audio, images, videos, directories and ‘other’, like we have in our frontend? But what, on Earth’s name is the definition of a ‘document’!?

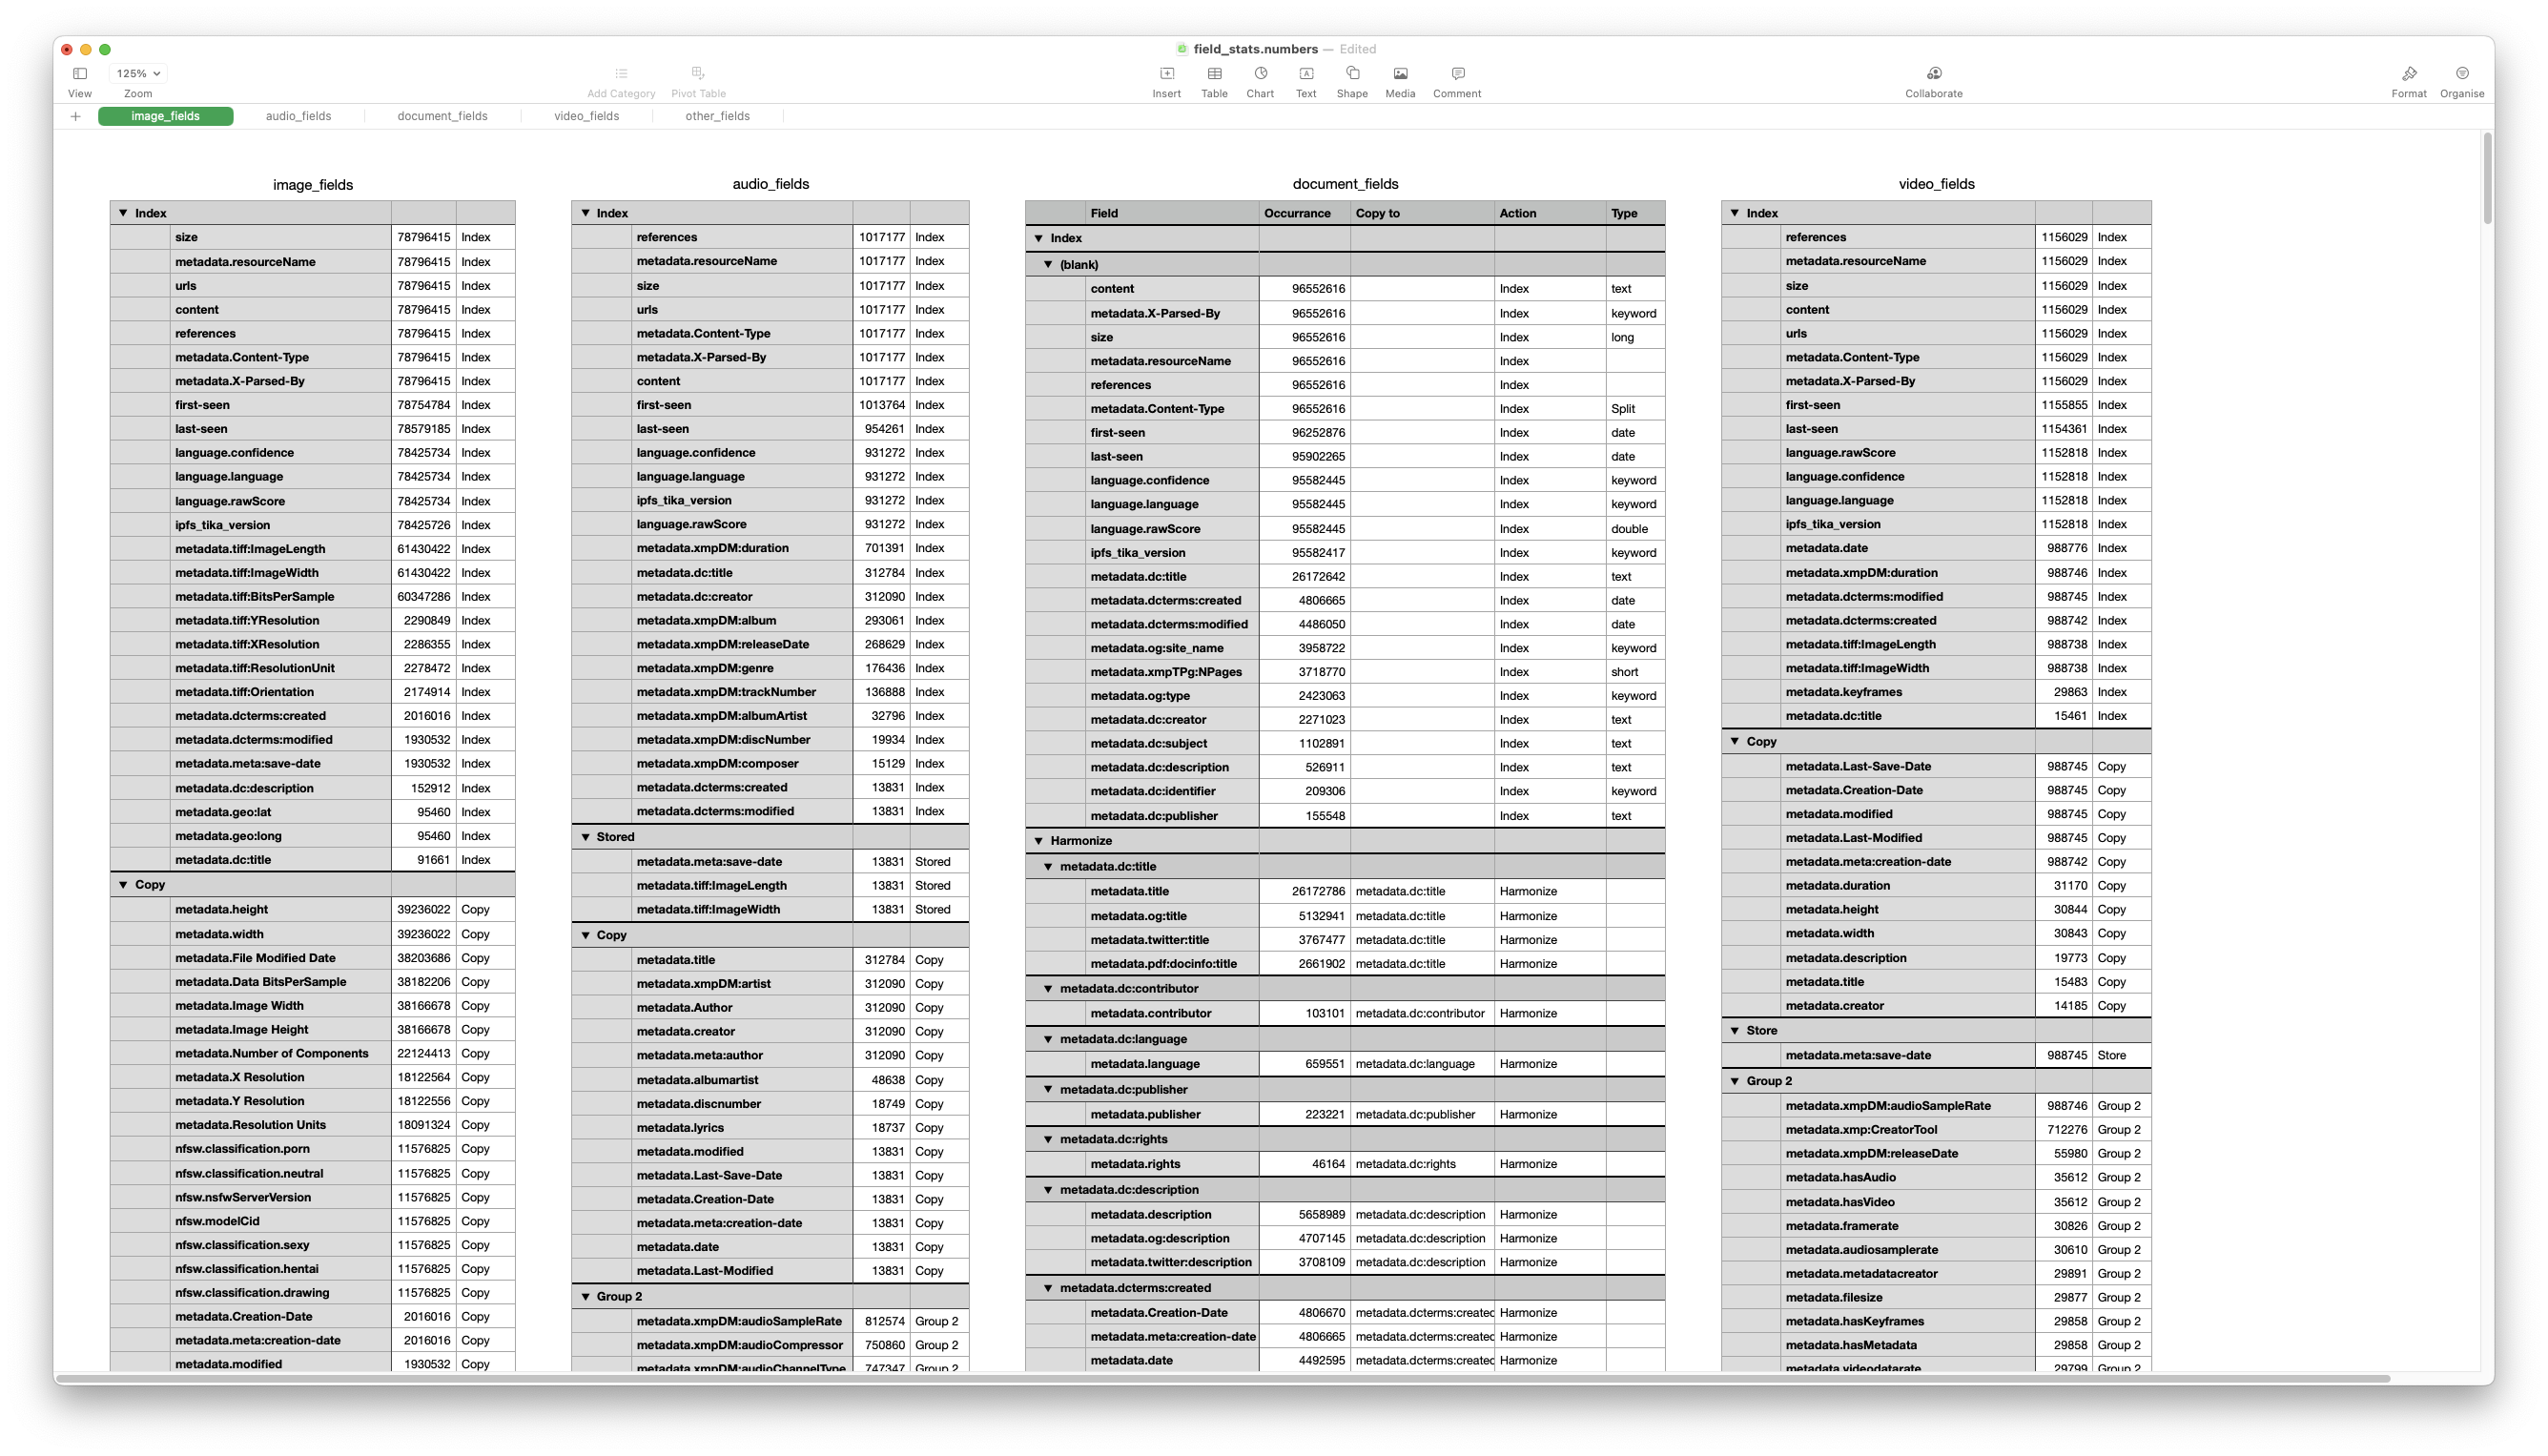
In order to make informed decisions about this, we decided to query our dataset for statistics, based on our ‘working’ definition of content types from the frontend. How many items of each category did we have? What sort of fields were present for various types and categories?
Field statistics
Hence, we produced extensive statistics with using scripted metrics, as that’s the only way to gather statistics on unindexed fields:
// Init
state.fields = new HashMap();

// Map
void iterateHashMap(String prefix, HashMap input, HashMap output) {
  input.forEach((key, value) -> {
    String fieldName = prefix + key;

    if (value instanceof Map) {
      iterateHashMap(fieldName + '.', value, output);
      return null;
    }

    if (output.containsKey(fieldName)) {
      output[fieldName] += 1;
    } else {
      output[fieldName] = 1;
    }
  });
}

iterateHashMap('', params['_source'], state.fields);

// Combine
state.fields

// Reduce
HashMap output = new HashMap();

states.forEach(field -> {
  field.forEach((fieldName, count) -> {
    if (output.containsKey(fieldName)) {
      output[fieldName] += count;
    } else {
      output[fieldName] = count;
    }
  })
});

return output;
Which adds up to the the following OpenSearch DSL query to get a list of fieldnames with occurance counts:
{
  "query": {
    "match_all": {}
  },
  "size": 0,
  "aggs": {
    "aggs": {
      "scripted_metric": {
        "init_script": "state.fields = new HashMap();",
        "map_script": "void iterateHashMap(String prefix, HashMap input, HashMap output) {  for (entry in input.entrySet()) {    String fieldName = prefix + entry.getKey();    if (entry.getValue() instanceof Map) {      iterateHashMap(fieldName + '.', entry.getValue(), output);    } else {      if (output.containsKey(fieldName)) {        output[fieldName] += 1;      } else {        output[fieldName] = 1;      }    }  }}iterateHashMap('', params['_source'], state.fields);",
        "combine_script": "state.fields",
        "reduce_script": "HashMap output = new HashMap();for (fields in states) {  for (field in fields.entrySet()) {    String fieldName = field.getKey();    Integer count = field.getValue();    if (output.containsKey(fieldName)) {      output[fieldName] += count;    } else {      output[fieldName] = count;    }  }}return output;"
      }
    }
  }
}
The result was a staggering amount of information, which we proceeded to sort out. We categorised each and every field: should it be copied, removed if it’s a duplicate, or simply not be indexed at all?
Mapping All the Things
With painstaking work and difficult decisions, we finally managed to arrive at a suitable mapping from mime types to indexes as well as which fields to index and how. Specifically, for some fields we chose to copy the data to another field but retain the source document intact. For others, we simply eliminated the source field (see ‘Deduplicating fields’ below).
This resulted in monsters of mappings, such as the following (for documents):
{
  "dynamic": "strict",
  "properties": {
    "cid": {
      "type": "keyword"
    },
    "content": {
      "type": "text",
      "term_vector": "with_positions_offsets"
    },
    "content:character-count": {
      "type": "integer"
    },
    "first-seen": {
      "type": "date",
      "format": "strict_date_time"
    },
    "last-seen": {
      "type": "date",
      "format": "strict_date_time"
    },
    "ipfs_tika_version": {
      "index": false,
      "type": "keyword"
    },
    "language": {
      "properties": {
        "confidence": {
          "index": false,
          "doc_values": false,
          "type": "keyword"
        },
        "language": {
          "type": "keyword"
        },
        "rawScore": {
          "type": "double"
        }
      }
    },
    "references": {
      "properties": {
        "hash": {
          "type": "keyword"
        },
        "name": {
          "type": "text"
        },
        "parent_hash": {
          "type": "keyword"
        }
      }
    },
    "size": {
      "type": "long"
    },
    "urls": {
      "enabled": false,
      "type": "object"
    },
    "metadata": {
      "dynamic": false,
      "properties": {
        "Content-Type": {
          "type": "keyword"
        },
        "mime:type": {
          "type": "keyword"
        },
        "mime:subtype": {
          "type": "keyword"
        },
        "X-TIKA:Parsed-By": {
          "index": false,
          "type": "keyword"
        },
        "dc:title": {
          "type": "text"
        },
        "dc:creator": {
          "type": "text"
        },
        "dc:contributor": {
          "type": "text",
          "index": false,
          "doc_values": false,
          "copy_to": "metadata.dc:creator"
        },
        "meta:last-author": {
          "type": "text",
          "index": false,
          "doc_values": false,
          "copy_to": "metadata.dc:creator"
        },
        "article:author": {
          "type": "text",
          "index": false,
          "doc_values": false,
          "copy_to": "metadata.dc:creator"
        },
        "dc:identifier": {
          "type": "keyword"
        },
        "xmpMM:DocumentID": {
          "type": "keyword",
          "index": false,
          "doc_values": false,
          "copy_to": "metadata.dc:identifier"
        },
        "xmpMM:DerivedFrom:DocumentID": {
          "type": "keyword",
          "index": false,
          "doc_values": false,
          "copy_to": "metadata.dc:identifier"
        },
        "xmpMM:DerivedFrom:InstanceID": {
          "type": "keyword",
          "index": false,
          "doc_values": false,
          "copy_to": "metadata.dc:identifier"
        },
        "Content Identifier": {
          "type": "keyword",
          "index": false,
          "doc_values": false,
          "copy_to": "metadata.dc:identifier"
        },
        "dc:language": {
          "type": "keyword"
        },
        "dc:description": {
          "type": "text"
        },
        "dc:subject": {
          "type": "text",
          "copy_to": "metadata.dc:description"
        },
        "meta:keyword": {
          "type": "text",
          "copy_to": "metadata.dc:description"
        },
        "dc:publisher": {
          "type": "keyword"
        },
        "dcterms:created": {
          "index": false,
          "type": "date",
          "format": "date_optional_time",
          "ignore_malformed": true
        },
        "dcterms:modified": {
          "index": false,
          "type": "date",
          "format": "date_optional_time",
          "ignore_malformed": true
        },
        "w:comments": {
          "type": "text",
          "index": false,
          "doc_values": false,
          "copy_to": "content"
        },
        "xmpTPg:NPages": {
          "type": "short"
        },
        "og:site_name": {
          "type": "text"
        },
        "og_type": {
          "type": "keyword"
        },
        "doi": {
          "type": "keyword",
          "index": false,
          "doc_values": false,
          "copy_to": "metadata.dc:identifier"
        },
        "pdf:docinfo:custom:IEEE Publication ID": {
          "type": "keyword",
          "index": false,
          "doc_values": false,
          "copy_to": "metadata.dc:identifier"
        },
        "pdf:docinfo:custom:IEEE Issue ID": {
          "type": "keyword",
          "index": false,
          "doc_values": false,
          "copy_to": "metadata.dc:identifier"
        },
        "pdf:docinfo:custom:IEEE Article ID": {
          "type": "keyword",
          "index": false,
          "doc_values": false,
          "copy_to": "metadata.dc:identifier"
        },
        "WPS-JOURNALDOI": {
          "type": "keyword",
          "index": false,
          "doc_values": false,
          "copy_to": "metadata.dc:identifier"
        }
      }
    }
  }
}
The final mappings for other types will soon be published in our docs. Until then, you may have a look at our WIP branch.
In the end, we indexed the following types together:
- (Compressed) archives: ZIP, tarballs, etc.
- (Textual) Documents: Text, HTML, Word, PDF, PowerPoint, etc.
- Images
- Videos
- Audio
- Directories
- Data: JSON, binary blobs, etc.
- Unknown: files with no extracted metadata whatsoever
- Other: Anything not in any of the aforementioned categories
Data cleanup
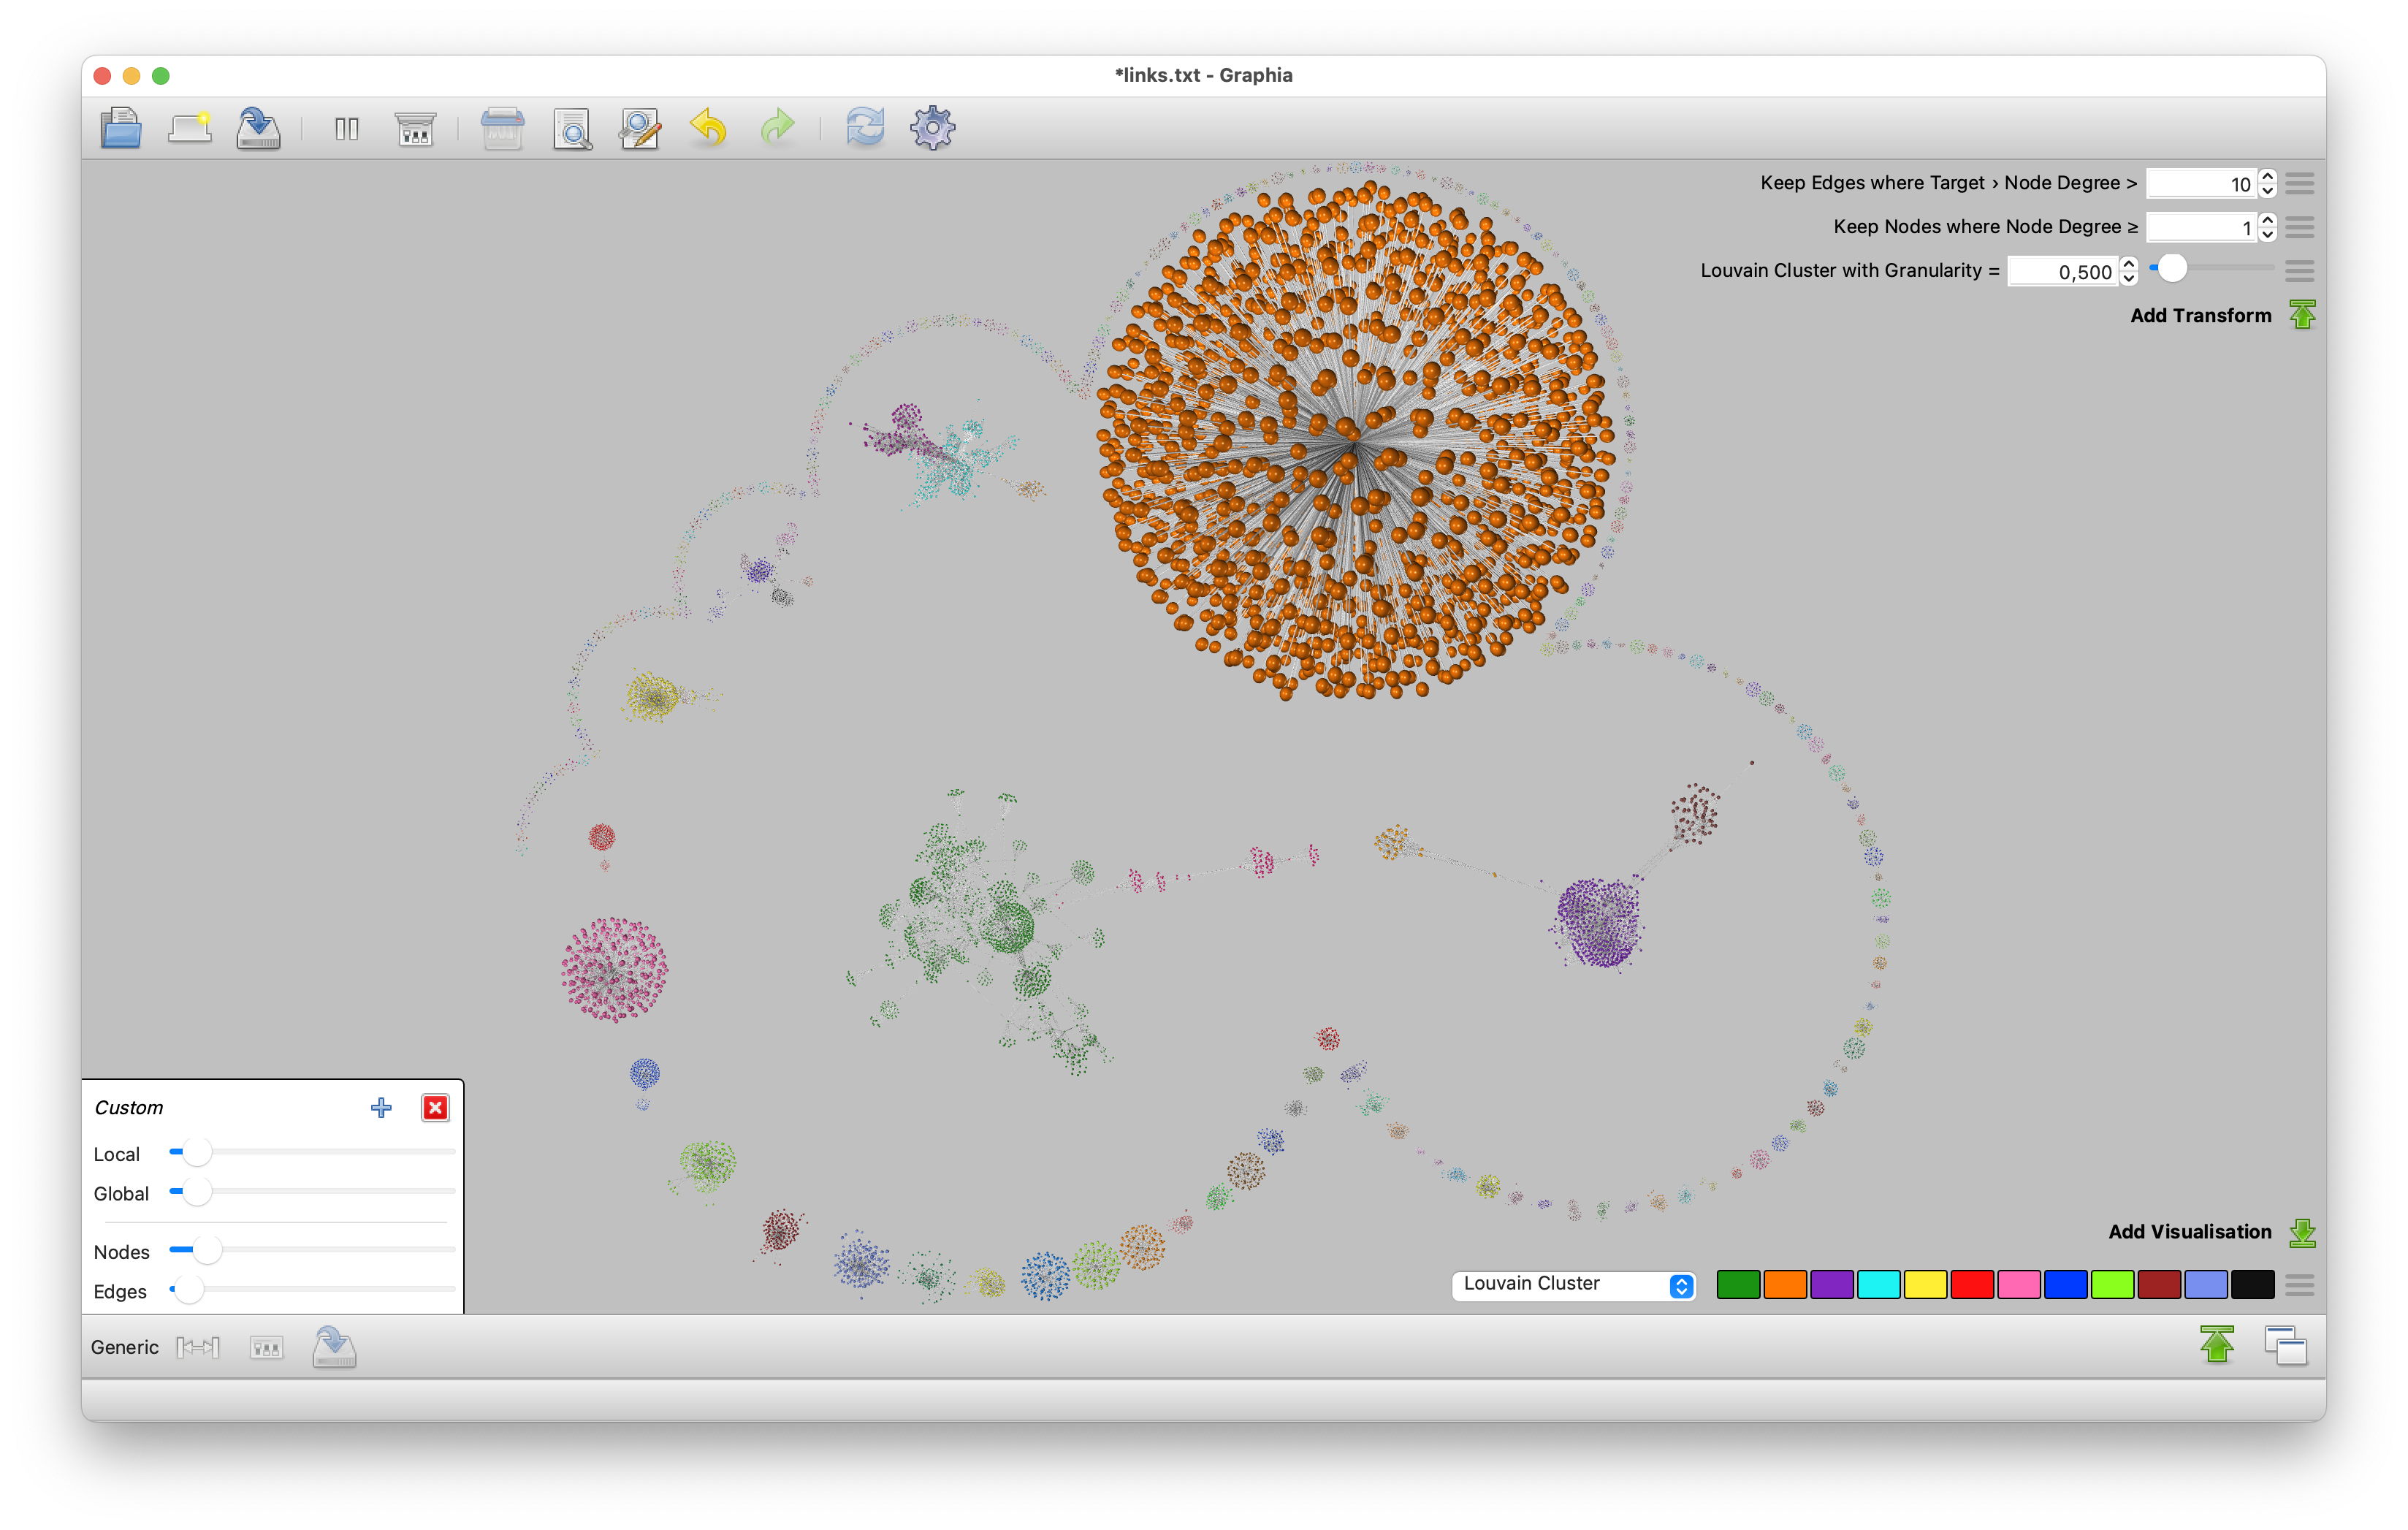
Hashing out 12 billion links!
During earlier development on the crawler, the suspicion started to arise that some of the documents in our index were ‘slightly’ larger than others. While implementing Redis caching for our indexer we discovered that some documents had thousands of links to them, whereas most documents have just one or a few.
It wasn’t until we wrote our linksplitter that we fully realized how bad the problem was! And in hindsight, it makes perfect sense: millions of Wikipedia articles with regular updates create new references to the same documents all the time. So we discovered that without knowing it, we were searching through a whopping 12.193.745.087 links! No wonder our search was slow!
At this time we merely split out the links to optimise search performance (chucking any but the last 8 references away during reindexing). But like you, we can’t wait to bring this dataset to the world — preferably loading it into and serving it from an actual graph database.
We have a graph of links on IPFS going back to 2019!
Deduplicating fields
Many fields were duplicates due to a lack of clear metadata standards in our metadata extractor based on Apache’s Tika. This meant carefully looking at our data, it meant scrutinizing Apache Tika’s developer documentation on metadata keys and it meant writing an intimidating ‘Painless’ (Elastic/OpenSearch built-in scripting language) to harmonize fields. In the process, we also created a shell-script ‘Painless’ uploader to make uploading ‘painless’ less … painful.
void harmonizeField(HashMap ctx, String srcFieldName, String dstFieldName) {
    if (ctx.containsKey(srcFieldName)) {
        ArrayList srcValues = ctx[srcFieldName];

        if (ctx.containsKey(dstFieldName)) {
            ArrayList dstValues = ctx[dstFieldName];

            if (srcValues == dstValues) {
                // src and dst values are equal, remove src
                ctx.remove(srcFieldName);
            }

            return;
        }

        ctx[dstFieldName] = srcValues;
        ctx.remove(srcFieldName);
    }
}

String nestedKey = 'metadata';
Map remapFields = [
        ...
    'w:comments': 'w:Comments',
    'comment': 'w:Comments',
    'Comments': 'w:Comments',
    'JPEG Comment': 'w:Comments',
    'Exif SubIFD:User Comment': 'w:Comments',
    'User Comment': 'w:Comments',
        ...
];

if (!ctx.containsKey(nestedKey)) return;

HashMap nestedCtx = ctx[nestedKey];

if (nestedCtx == null) return;

for (entry in remapFields.entrySet()) {
    String srcFieldName = entry.getKey();
    String dstFieldName = entry.getValue();

    harmonizeField(nestedCtx, srcFieldName, dstFieldName);
}
Re-hashing document ID’s
During critical reflection along the lines of “why are these 5 darn servers taking all our load!??? 🤯”, we figured that one potential cause could be an unequal distributions of documents among shards due to us using IPFS/IPLD CID’s as document identifiers. See, all CID’s start with just one of a few options of the same bytes.
If the underlying index doesn’t re-hash them, a lot of documents could end up together in ways which are sub-optimal and/or the shard distribution could end up all messed up. As we weren’t able to find conclusive evidence in OpenSearch’ code as to whether or not custom (vs. generated) DocID’s were hashed, we decided to re-hash them using SHA1.
As a bonus, this allowed us to do one other thing we’ve been wanting to do, which is adding a protocol identifier to our documents, paving the way for future support of other content-addressed protocols (e.g. ipfs://bafy... overbafy...).
Luckily, someone published a SHA1 implementation for Painless which we thankfully made use of!
Other ‘Painless’ stuff
While we were undertaking the huge effort of Reindexing All the Things, we decided to also implement some other ‘nice to haves’:
- Cropping body content to 1 MB (some were as large as 10 MB!).
- Splitting mime types into their constituent type, subtype and parameters.
- Adding character counts (size) for body content.
Re-index From Hell
With the mapping and all our scripts snugly fit into an ingest pipeline, we were ready to start re-indexing. Writing horrendous queries such as this to sort our documents based on mimetype along the process:
{
  "source": {
    "index": "ipfs_files_v9",
    "query": {
      "bool": {
        "filter": {
          "range": {
            "first-seen": {
              "gte": 2023,
              "lt": 2024,
              "format": "yyyy"
            }
          }
        },
        "should": [
          { "wildcard": { "metadata.Content-Type": "text/x-web-markdown*" }},
          { "wildcard": { "metadata.Content-Type": "text/x-rst*" }},
          { "wildcard": { "metadata.Content-Type": "text/x-log*" }},
          { "wildcard": { "metadata.Content-Type": "text/x-asciidoc*" }},
          { "wildcard": { "metadata.Content-Type": "text/troff*" }},
          { "wildcard": { "metadata.Content-Type": "text/plain*" }},
          { "wildcard": { "metadata.Content-Type": "text/html*" }},
          { "wildcard": { "metadata.Content-Type": "message/rfc822*" }},
          { "wildcard": { "metadata.Content-Type": "message/news*" }},
          { "wildcard": { "metadata.Content-Type": "image/vnd.djvu*" }},
          { "wildcard": { "metadata.Content-Type": "application/xhtml+xml*" }},
          { "wildcard": { "metadata.Content-Type": "application/x-tika-ooxml*" }},
          { "wildcard": { "metadata.Content-Type": "application/x-tika-msoffice*" }},
          { "wildcard": { "metadata.Content-Type": "application/x-tex*" }},
          { "wildcard": { "metadata.Content-Type": "application/x-mobipocket-ebook*" }},
          { "wildcard": { "metadata.Content-Type": "application/x-fictionbook+xml*" }},
          { "wildcard": { "metadata.Content-Type": "application/x-dvi*" }},
          { "wildcard": { "metadata.Content-Type": "application/vnd.sun.xml.writer.global*" }},
          { "wildcard": { "metadata.Content-Type": "application/vnd.openxmlformats-officedocument.wordprocessingml.document*" }},
          { "wildcard": { "metadata.Content-Type": "application/vnd.openxmlformats-officedocument.spreadsheetml.sheet*" }},
          { "wildcard": { "metadata.Content-Type": "application/vnd.openxmlformats-officedocument.presentationml.presentation*" }},
          { "wildcard": { "metadata.Content-Type": "application/vnd.oasis.opendocument.text*" }},
          { "wildcard": { "metadata.Content-Type": "application/vnd.ms-powerpoint*" }},
          { "wildcard": { "metadata.Content-Type": "application/vnd.ms-htmlhelp*" }},
          { "wildcard": { "metadata.Content-Type": "application/vnd.ms-excel*" }},
          { "wildcard": { "metadata.Content-Type": "application/vnd.sun.xml.draw*" }},
          { "wildcard": { "metadata.Content-Type": "application/rtf*" }},
          { "wildcard": { "metadata.Content-Type": "application/postscript*" }},
          { "wildcard": { "metadata.Content-Type": "application/pdf*" }},
          { "wildcard": { "metadata.Content-Type": "application/msword5*" }},
          { "wildcard": { "metadata.Content-Type": "application/msword2*" }},
          { "wildcard": { "metadata.Content-Type": "application/msword*" }},
          { "wildcard": { "metadata.Content-Type": "application/epub+zip*" }}
        ],
        "minimum_should_match": 1
      }
    }
  },
  "dest": {
    "index": "",
    "pipeline": "ipfs_files_cleanup_v11"
  }
}
Year by year
This in and by itself was already a bit of a tedious process, but then we started having stability issues and operations started to unpredictably crash. With over 300 million documents to re-index (the others being invalids and partials, not requiring re-indexing) we couldn’t risk losing all of our progress so, as you see, we started indexing documents by year.
10 documents at a time
As you might have gathered from some of the subtle hints above, some of the documents in our index were really humongous in size. Some have well over 10 MB in links/references, some have up to 10 MB in body content (full text-indexed!). Knowing that OpenSearch’ indexing bulk indexing buffers are 100 MB, this turned out quite problematic.
While the point of our re-index is exactly to get rid of these huge documents, in order to do so we’d have to process them and, without jumping through even more horrible hoops, meant indexing nearly a billion documents in batches of 10, in order not to overflow Elastic’s buffer.
Out of file descriptors!?
And then, during the process we increasingly experienced random nodes disappearing. By now, we were used to quite a bit of 💩 from OpenSearch. But it got to the point where we were literally unable to complete simple indexing operations without a node disappearing, killing the re-index scroll in the process.
We got these weird and uncommon exceptions from OpenSearch, telling us there were not enough file descriptors. What the!?? So, we dug deeper…
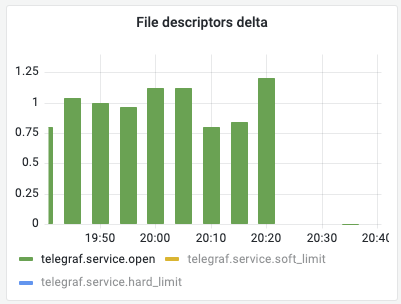
It turned out that not OpenSearch. Not Kubo. Not our crawler but… Telegraf, Influx’ metrics collecting daemon, was eating our file descriptors. And not just in any way, it was doing so tediously slowly, adding 1 FD per second, creating a problem which was so slow to emerge that it took months to manifest.
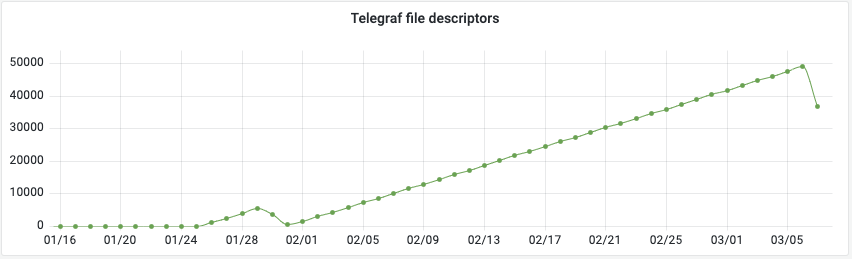
Once it was discovered that Telegraf was the culprit though, it was easy enough to identify the malignant code, a plugin logging ethernet statistics to attempt to diagnose the scaling behaviour discussed prior in this post (in order to exclude ethernet ring buffer overflows).
Open Source is Awesome
Being good FOSS citizens, an issue was created on Influx’ Telegraf repo which was reviewed that same day. Only to find that the next day they already had a PR ready, complete with an artifact allowing us to verify that the issue was indeed resolved. Within 6 days Influx released an updated version.
This is incredible! We ❤️ 💚 💙 💖 Open Source! And… great work InfluxDB, you got good things going on! 👀
As soon as this was resolved, our cluster was rock stable again and finally managed to Reindex All the Things. Ready for testing!
Re-sharding All the Shards
Except, not really. When you’re building an index in OpenSearch/ElasticSearch, you kind of have to guesstimate the amount of shards. The general recommendation is that a single shard should be between 10 and 50 GB in size, ideally 20-30 GB. Yet, there’s no reliable way to know the size of the index ahead of … indexing.
Of course we estimated the size of shards, using the fraction of total documents times the total size (~15 TB) of our files index. But as we discovered, many documents have different sizes, different fields and some of our estimates were way off.
Eventually, we had to shrink (merge shards) on some of our indexes and split shards on some others, finally we brought all of them within the desirable range. Mind you, our cluster only handles these kinds of processes well for one index at a time and they can take up to 24h to complete.
After which we set up replication and waited another half a day for the cluster to balance. And then, only then, are we ready to actually use our indexes.
Rewriting our API server
But wait… we just went from searching 2 indexes (files and directories) to searching 9 of them! However we approach this, it means a profound change to the way our queries function. How are we going to integrate that into our vanilla JS API server, most of which has not been touched in a year? Particularly, how are we going to make sure that we’re not missing out on relevant search results just because we made a silly typo?

Typing All the Things!
Our solution was to Rewrite it in Rust TypeScript. Simply put, we have a lot of literals, there is a lot of code to rewrite/migrate — our API server really hasn’t gotten the love it deserves, pending a full rewrite like this. Type inference in this case allows us to do abstract reasoning over types such that if our code isn’t right, it simply won’t compile.

For example, in the API server we’ve created types for:
- Document fields, with field name literals.
- Document’s source, as a subset of document fields.
- Query fields (including boosts and highlights), again restrained by document fields.
Thanks to this approach, it becomes literally impossible to refer to non-existing fields or missing data because a typo in a field name (except, of course, where the literals are defined). We already caught several bugs of which we were not previously aware from our older API code.
We also created a new common types library, we’ve implemented types for:
The shared types between client and server allows for much stronger consistency in implementation. This will help us and you, power-user you are, to talk to our service in predictable and reliable ways.
Searching for subtypes through our new indexes
As a bonus of this great rewrite, users will soon have access to a subtype field in addition to type in queries and results, based on our newly generated indexes. This will have zero resource-impact for us (rather the opposite) and will allow you to query directly for:
- Archives.
- Audio.
- Data.
- Documents.
- Images.
- Videos.
- Unknown’s and;
- the illustrious ‘Other’.
Monorepo’s for JS hipsters 〰️
Like all the fashionable kids (and some of our Goliath competitors) these days, we decided to rock with a proper monorepo with our client, our server and types as separate packages bundled snuggly together. To orchestrate it all, we opted for Lerna, the now-not-so-hip anymore wrapper around the increasingly hyped Nx build system.

This not only allowed us street cred’ and swag around places where espresso is served so fashionably bitter it turns your cheeks concave, it also allows us to:
- Publish everything to NPM at once.
- Keeping versions in sync.
- Perform end-to-end integration testing from client to server.
- Rapidly iterate on the API, ensuring consistently without managing tons of repo’s.
Isn’t JavaScript, I mean ECMAScript, I mean TypeScript, I mean Node, I mean NPM, native ESM, I mean ALL OF THIS JUNK TOOLING which gets replaced every 3 DOODLING MONTHS AMAZING? Hipster 💩, yes. We’re into it!
Now, we can do all the things Perl people were doing in the 90’s. Except, with Prettier, our code doesn’t look like Larry Wall fell asleep on his keyboard once.
Anyways, as with all our stuff, the Source is Out There(tm) and soon, arguably, merged to main and published to NPM (which is not at all like CPAN and definitely not as well designed!).

Ready for testing!
So now, without further ado, we are really ready for testing!
That sound you hear when the deadline’s passed by, yes, we heard it. A couple of times. Not to mention the sound of 💸 we could have made while we were making the first and only search engine for IPFS more awesome.
But, lo and behold…
1300 hit/s! Wow! Uau! 😮💥
“Uau”, that’s what Portuguese people say. And it happens, I live there. So that’s what I said.
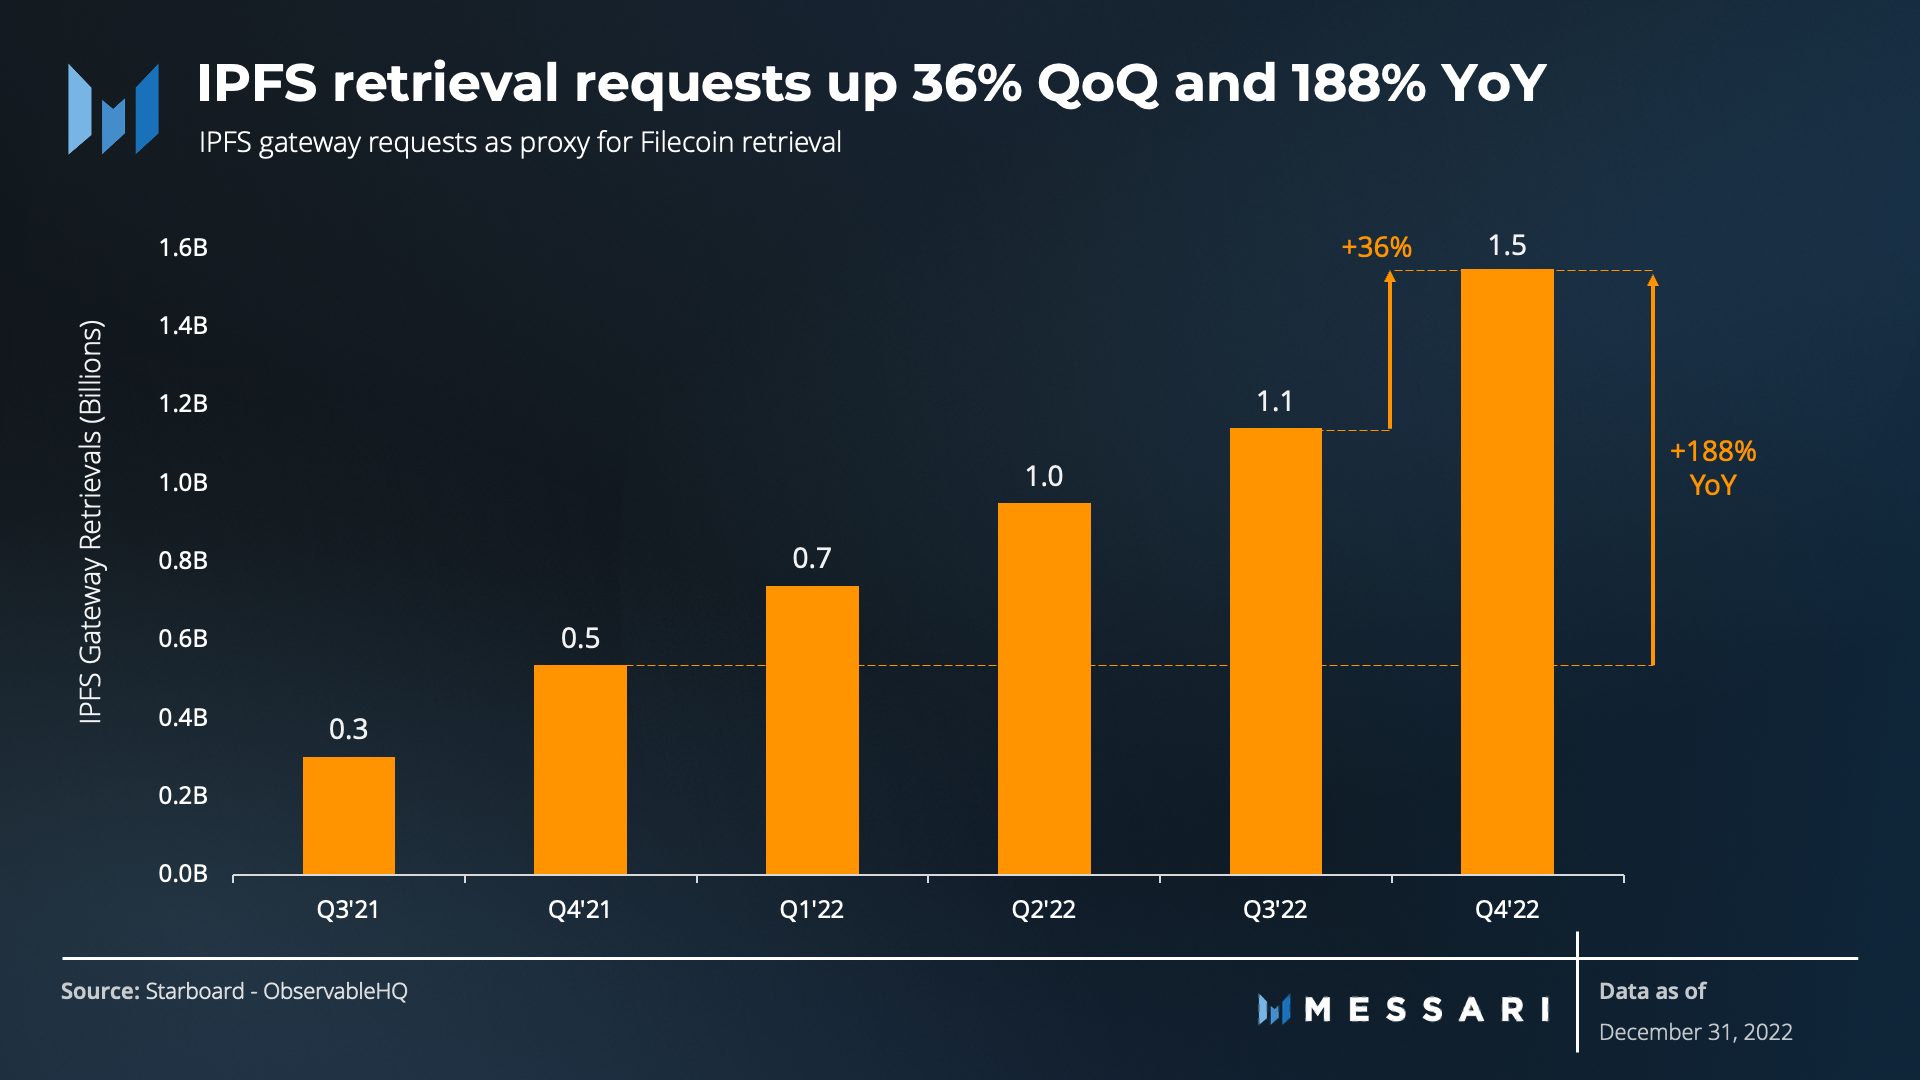
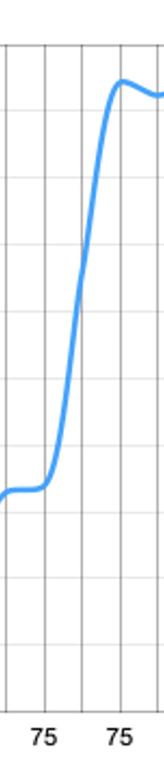
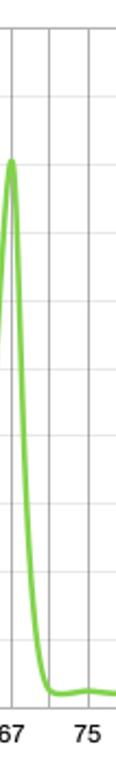
Remember that graph we started with? Noticed the part where with the same amount of nodes we suddently jumped up? And where request duration plummeted down? No, I am not making a reference to the disgraceful state of the climate or the economy. There’s good things happening in this world.
Our search engine getting incredibly faster, for one thing. We hit well over 1300 hits per second, 30% more than we expected to, with only 75% of the 100 nodes we estimated for it. That’s equivalent of serving over 3000 users so fast they will not even know they were waiting.
Soon(tm), because although our goal it has succeeded, QED and all, there is still a bit of cleanup to do!
Wrapping things up
For one, we are not yet indexing new stuff until we’ve refactored our crawler. Only then we can add what’s been indexed since we ran this test. And only then can we throw away our old index, making space, scaling down our cluster again to what we currently need. In the full awareness that…
We Are Ready For It!
Bring it on! Users of the world, unite! Come, seek with us the Interplanetary Filesystem and thou shalt find!