Introduction
In fall 2021 we started the ambitious work of seeing whether ipfs-search.com could truly handle web-scale traffic. Through the grapevine, we’d heard how a well known search engine might be interested in searching IPFS. Searching IPFS is what we do since 2016, so we said “challenge: accepted”.
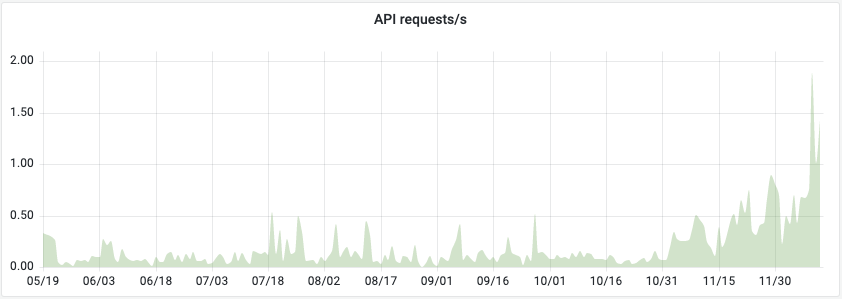
The same grapevine told us that this search engine handles about 1000 requests per second. At the time, we were handling about 0.1 requests/second, so quite a difference. However, in our statistics we’re seeing early signs of exponential growth, in which case 4 orders of magnitude really doesn’t take that long.
Being passive on the internet means explosive growth will overwhelm you. Our success might well be the cause of our demise. Or worse; as with many start-ups we might feel forced to give up our ideals under market pressures, just to survive.
This is the first part in a two-post blog miniseries, where we describe how indeed we managed to surpass our ambitions of handling 1000 requests per second.
It’s elastic, right?
We were running Elastic (currently OpenSearch, as Elastic isn’t Open Source anymore), a document store specifically designed to scale and handle gigantic datasets. After Google’s publication in the early 2000’s of MapReduce, the smart folks behind Elasticsearch (amongst others) built a FOSS (Free and Open Source) search index with it. In theory, allowing scaling without a limit. However…
Theory doesn’t work in practice.
Early benchmarks suggested that a single node was able to handle 10 queries per second. Which, again in theory, suggested that merely scaling out our cluster from 4 to 100 servers ought to do it. But alas, it wasn’t so easy.
As soon as we scaled our cluster from 4 up to 30 nodes, average response times shot up to over half a second! Mind you, these are averages — it implies that some of our users had to wait for several seconds for search results.
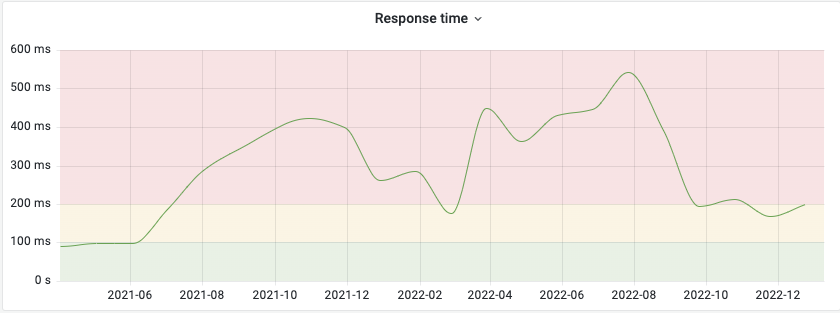
The Internet is impatient!
Unlike visitors of your local library, users have strong expectations when it comes to looking for information on the internet. Wait more than 200 ms and a website is experienced as slow. Wait more than 1 second and you’ll start interrupting the user’s flow. More than a few seconds and users will leave, never to return again. (Reference) It doesn’t matter how many queries per second we can serve, it’ll be useless if we’re serving them too slowly!
Endless fidgeting with knobs
Like any large and complex machine, Elastic/OpenSearch has a large number of configuration options which one can spend a lifetime tuning. Sadly enough, it seems that few experts in the field have bothered to share detailed knowledge. As soon as one leaves the ‘safe’ territory of the Proof of Concept, enter the domain of the Tech Consultant. Search being our core activity, this is potentially an endless sinkhole of funds, which we do not have in the first place!

Rather than Outsourcing All The Things, we ended up becoming the consultants ourselves. Which is one of the reasons it took us over a year to learn how to overcome these obstacles, with the end result being that we now have all the knowledge in-house. (We did get some help, but more towards the practical side of the implementation.)
Over time, we tried:
- Increasing the number of index shards and…
- … decreasing them again.
- Increasing the number of replicas and…
- … decreasing them again.
- Tuning our refresh interval.
- Implementing batching/bulk reads and writes for our crawler.
- Tuning our index buffer size.
- Searching rounded dates.
- Upgrading from ElasticSearch to OpenSearch and…
- Upgrading OpenSearch again.
- Reindexing All The Things, several times.
- Ensuring persistent (keepalive) connections for search clients.
- Tuning max_merge_count to prevent index throttling.
- Reducing our crawling rate.
- Enabling shard location awareness and…
- … disabling it again.
- Tuning max_concurrent_shard_requests in search queries.
- Enabling
_localshard preference in queries and… - … disabling it again.
- Setting per-shard search API
timeout. - Set translog durability to async.
- Tuning
reclaim_deletes_weight.
Resources
- Tune for indexing speed by Elasticsearch
- Tune for search speed by Elasticsearch
- How to avoid index throttling, deep dive in segments merging by Denis Gladkikh
- Adjusting Merge Settings to Make Frequent Updates Less Painful by Reason
- Elasticsearch Performance Optimization by Alibababa
- How can I improve the indexing performance[…]? by Amazon
Reading and writing, but not at the same time!
It turns out there was not a single factor which could be clearly outlined as the ‘root cause’ of our issue, rather a number of factors was colluding. However, discovered there was resource contention between our crawler’s indexing and search queries. This is also why many of our measures focused on improving search through improving index performance. In the end, implementing asynchronous/bulk reads and writes significantly increased the stability of our cluster, reducing both the variance in response times as well as the average.
It did become clear though, as would be expected, that performing crawling in bulk and asynchronously was a major factor in getting our response times under control. And so in summer ‘22 it finally seemed we were ready to continue scaling, but…
Our benchmark haven’t started yet!
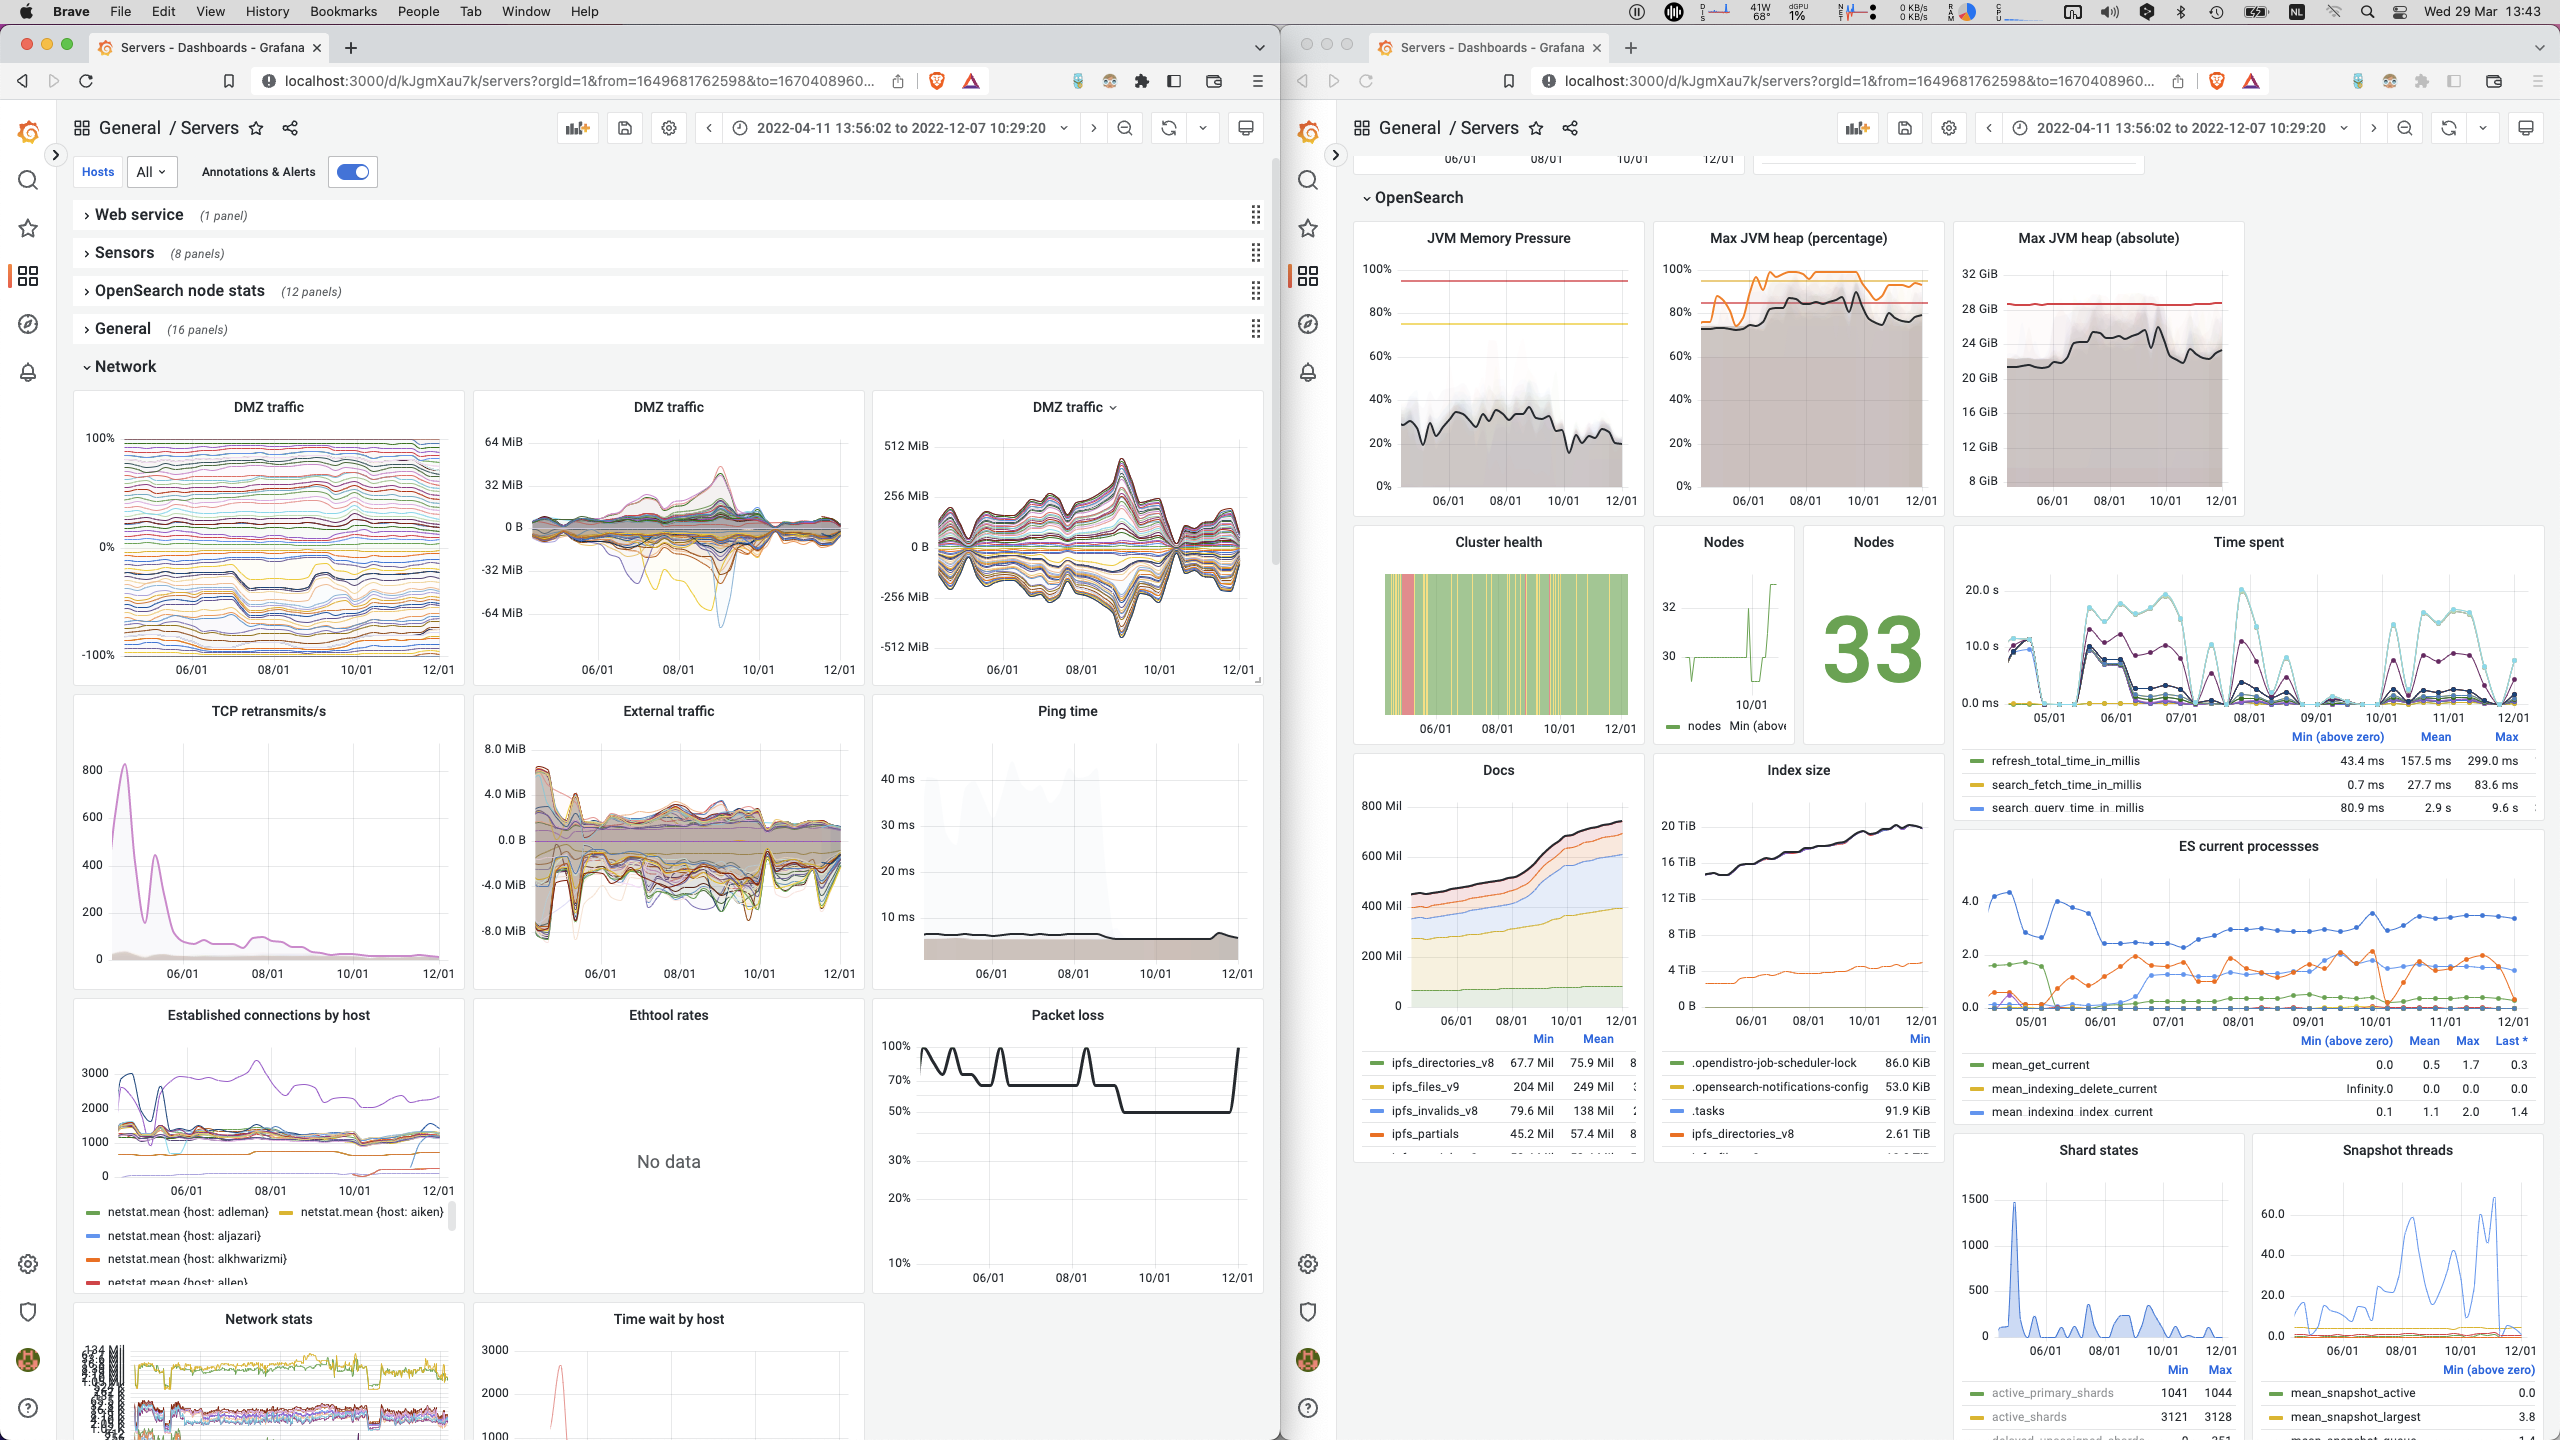
Throughout the ‘minor’ delay and distraction of finally getting these darn response times under control, we went waaaay overboard creating extremely insightful monitoring dashboards. We implemented deep-reaching functionality in our crawler, of all components.
But we hadn’t yet managed to scale our cluster beyond 33 nodes! Nor develop or run our actual benchmark! Want to learn how we achieved this?
Continue reading our second post.